This article will show us how to display API data on a website and look at various formats we can use such as displaying API data as a chart, displaying API data as a Table and displaying API data as HTML on a website.
We will use the JSON API Converter to format the API data and then display it on your website, without writing any code.
What is an API
An API is basically a way for 2 (or more) software applications to talk to each other. An API can send or receive data in a specific format in a way that makes it easy for the 2 applications to communicate.
And while an API may be a good way for applications to communicate, the data within APIs is not very easily read by humans. So we need a way to take the API data and make it human readable.
The most popular type of data that an API contains is JSON data, which is pretty ugly to look at and very difficult to make sense of.
Connecting to an API
Unless you are a web professional or a very techy person, often it is a challenge to even connect to an API, let alone being able to view the API data.
All APIs will have endpoints, and these are essentially just URLs. You can try pasting the URL into your browser and see what the page shows. If it shows the API data, then your API is a simple API that does not require an API key or some other type of authorisation or authentication.
If your API requires authorisation/authentication, then this is where it can get really tricky. API Widgets provides the means to connect to APIs that require various types of Auth such as API Keys, Bearer Tokens and Basic Auth.
Let’s look at how easy it is to connect to an API using API Widgets and then we will show you how easy it is to display API data on a website.

Click on the Converter button above and it will take you to the page where we can start converting your API data into a nice, readable format.
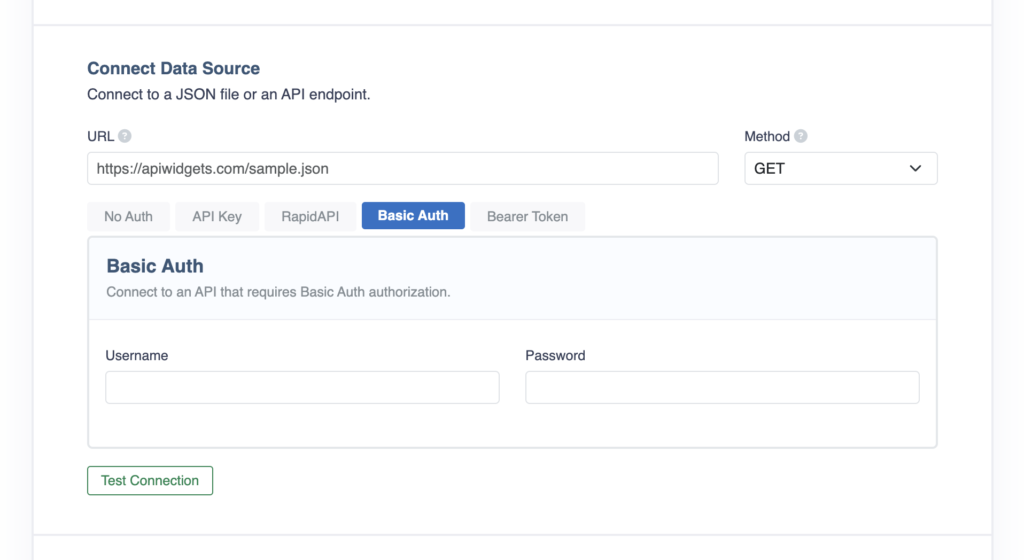
This image shows how we connect a Data Source (which is the API) using the Basic Auth method. You simply need to add your API endpoint URL and add the Username and Password for the API and the connection to the API is all handled in the back end. You don’t need to touch any code, ever.
It is the same for all of the Auth methods. You simply need to fill in the required fields and the connection is handled seamlessly behind the scenes.
Display API data in chosen format
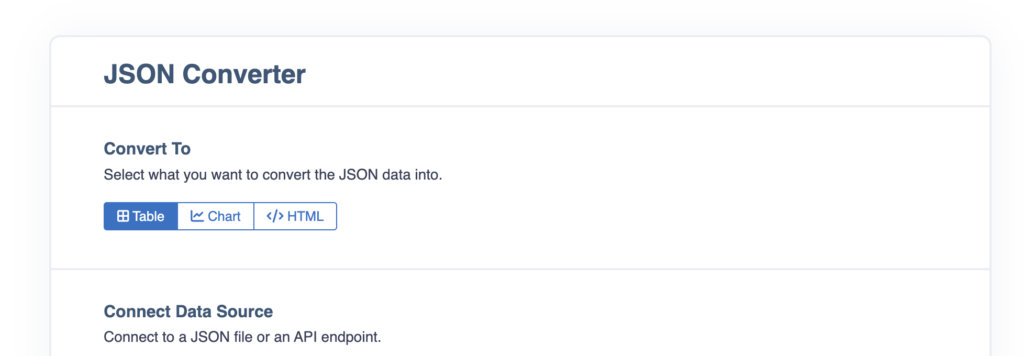
On the Converter page you will also see the options for formatting the API data. The options are Table, Line Chart, Bar Chart, Pie Chart and HTML.

The Table and Chart options are extremely straightforward and don’t require any special type of knowledge to get amazing looking results you can display on your website.
The HTML option is also straightforward to convert the API data to HTML but after that, some knowledge of HTML and CSS will be required to style the HTML and getting looking the way you want it to look on your website.
Display API data on website
After adding the API details and selecting the formatting type, you’ll be taken to the main Converter page where you can select your API data and do the conversion.
Check out the in-depth articles below for instructions on exactly how to do this:
Now that you have converted the API data and formatted your API data into the chosen format, you’ll want to display it on your website.
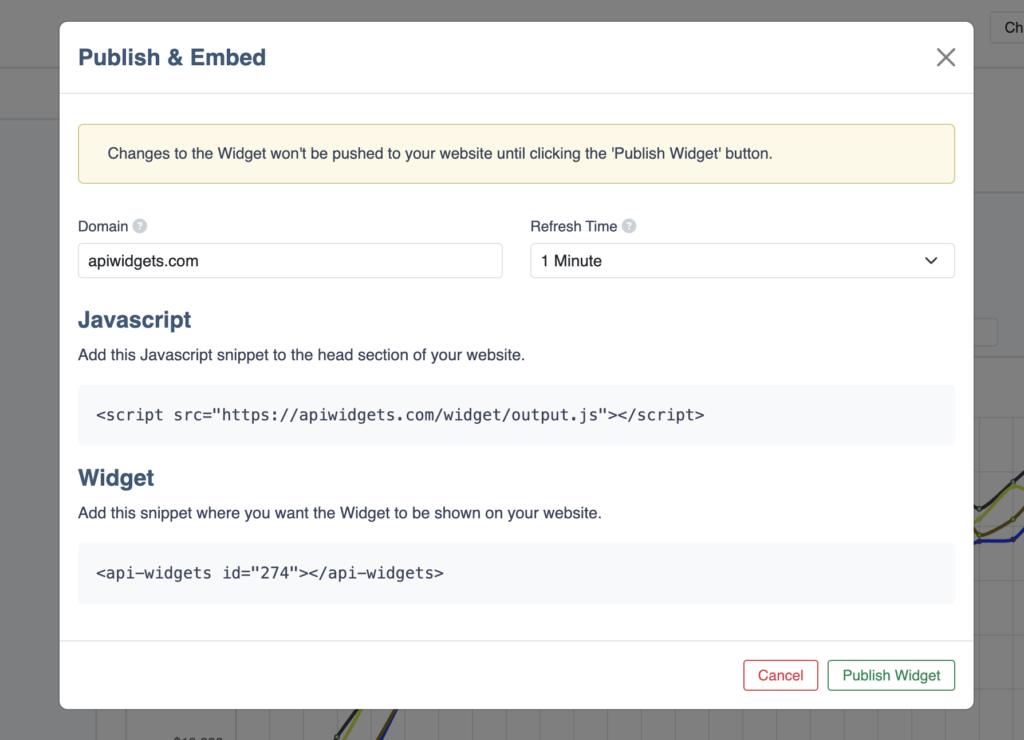
You simply need to click on the Embed button and you will see this popop:

Fill in the Domain of your website where you will be displaying the API data and select the Refresh Time which determines how often the API data will be refreshed on your website.
Once that is done, copy the 2 embed codes and click the Publish Widget button.
You then simply need to add the 2 lines of code to your website wherever you want to display the API data. The API data will be displayed in the format that you chose and it will auto update with new data from the API.
That’s it. That’s how simple it is to display API data on your own website without any coding.
Check out more of our articles in the Docs section.